
EDUCATIONAL RESOURCES
Explore how different climate hazards affect our health
Click on each of the climate hazards—air pollution, heatwaves, floods, and wildfires—to discover how they transform and challenge urban life. As you navigate through the hazards, you’ll uncover a variety of educational resources designed to help you learn more about the science behind each phenomenon, their effects on people and their health.
To make your experience even more relevant, select from the audience categories below. Whether you’re a citizen, researcher, healthcare provider or policymaker, you’ll find tailored materials suited to your interests and needs.





HEATWAVES
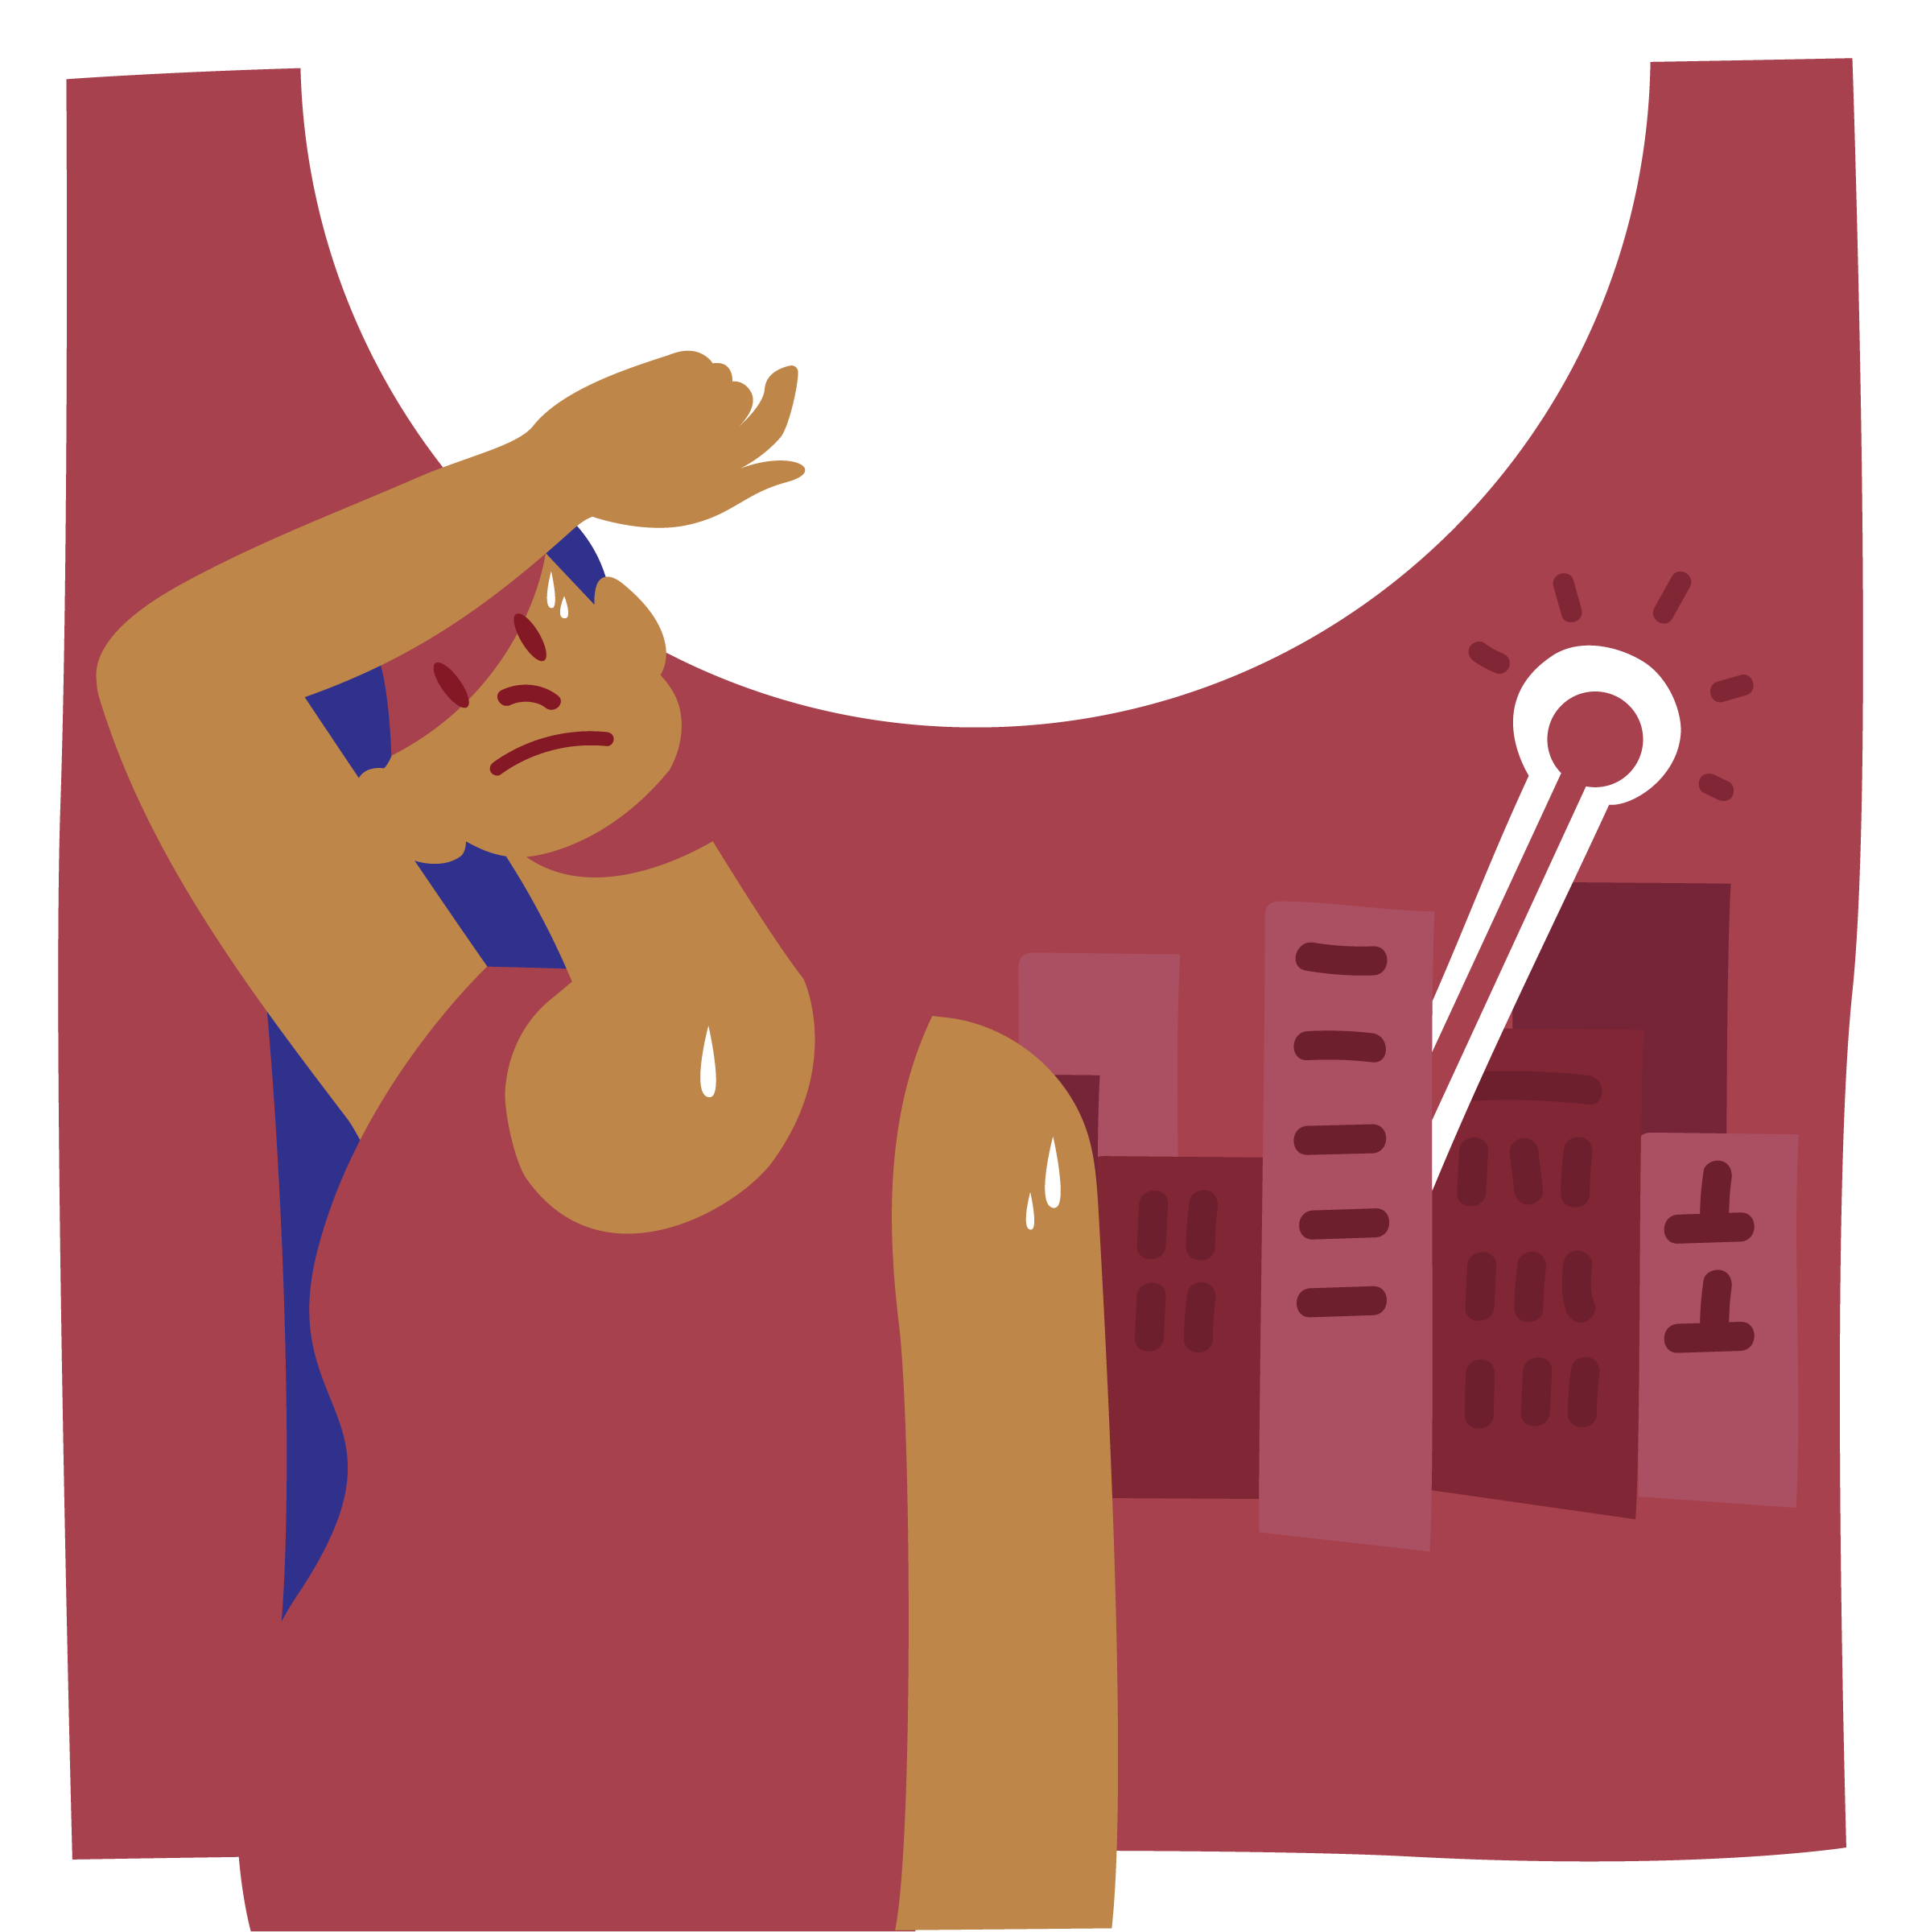
As climate change accelerates, heat waves are becoming more frequent, intense, and longer-lasting. It’s essential that we prepare ourselves, our communities, and our systems to face heat waves and reduce their impacts.
Whether you’re a citizen, a healthcare provider, or a policy maker, we all have a role to play in building resilience and promoting our wellness.
Explore how we can better understand, respond to, and mitigate the effects of extreme heat.


Air Pollution
Air pollution occurs when harmful substances build up in the air we breathe. Though often invisible, polluted air can seriously affect our health, damage ecosystems, and reduce quality of life.
As climate change intensifies, air pollution is becoming more persistent. Rising temperatures, droughts, and wildfires worsen air quality, while cities face additional risks from the Urban Pollution Island effect, where pollutants accumulate and remain trapped for longer periods.
It’s essential that we prepare ourselves, our communities, and our systems to respond and reduce its impacts.
Floods
Floods occur when water rises faster than the land can absorb it. They are among the most common and damaging natural hazards, affecting millions of people each year.
Climate change is increasing their frequency and severity. Warmer air holds more moisture, leading to heavier rainfall, while built-up landscapes reduce natural drainage.
Floods can harm our health, disrupt daily life, and damage homes and infrastructure. Preparing ourselves, our communities, and our systems is essential to reduce these impacts
Wildfires
Wildfires are uncontrolled fires that burn through forests and other vegetation. While they can occur naturally, climate change and human activity are making them more frequent and more intense.
Hotter temperatures, drought, and dry landscapes create ideal conditions for fires to ignite and spread. Their impacts can be severe—causing injuries, smoke-related health problems, damage to homes and ecosystems, and major economic losses.
Preparing ourselves, our communities, and our systems is essential to reduce these risks.

Stay indoors during the
hottest hours (11 am–4 pm).
Drink plenty of water regularly,
even if you don’t feel thirsty.

Eat light, fresh foods; avoid
heavy or hot dishes.

Wear loose, light-colored,
breathable clothing.

Never leave children, pets, or
electronics inside.

Close blinds, use fans,
ventilate at night.
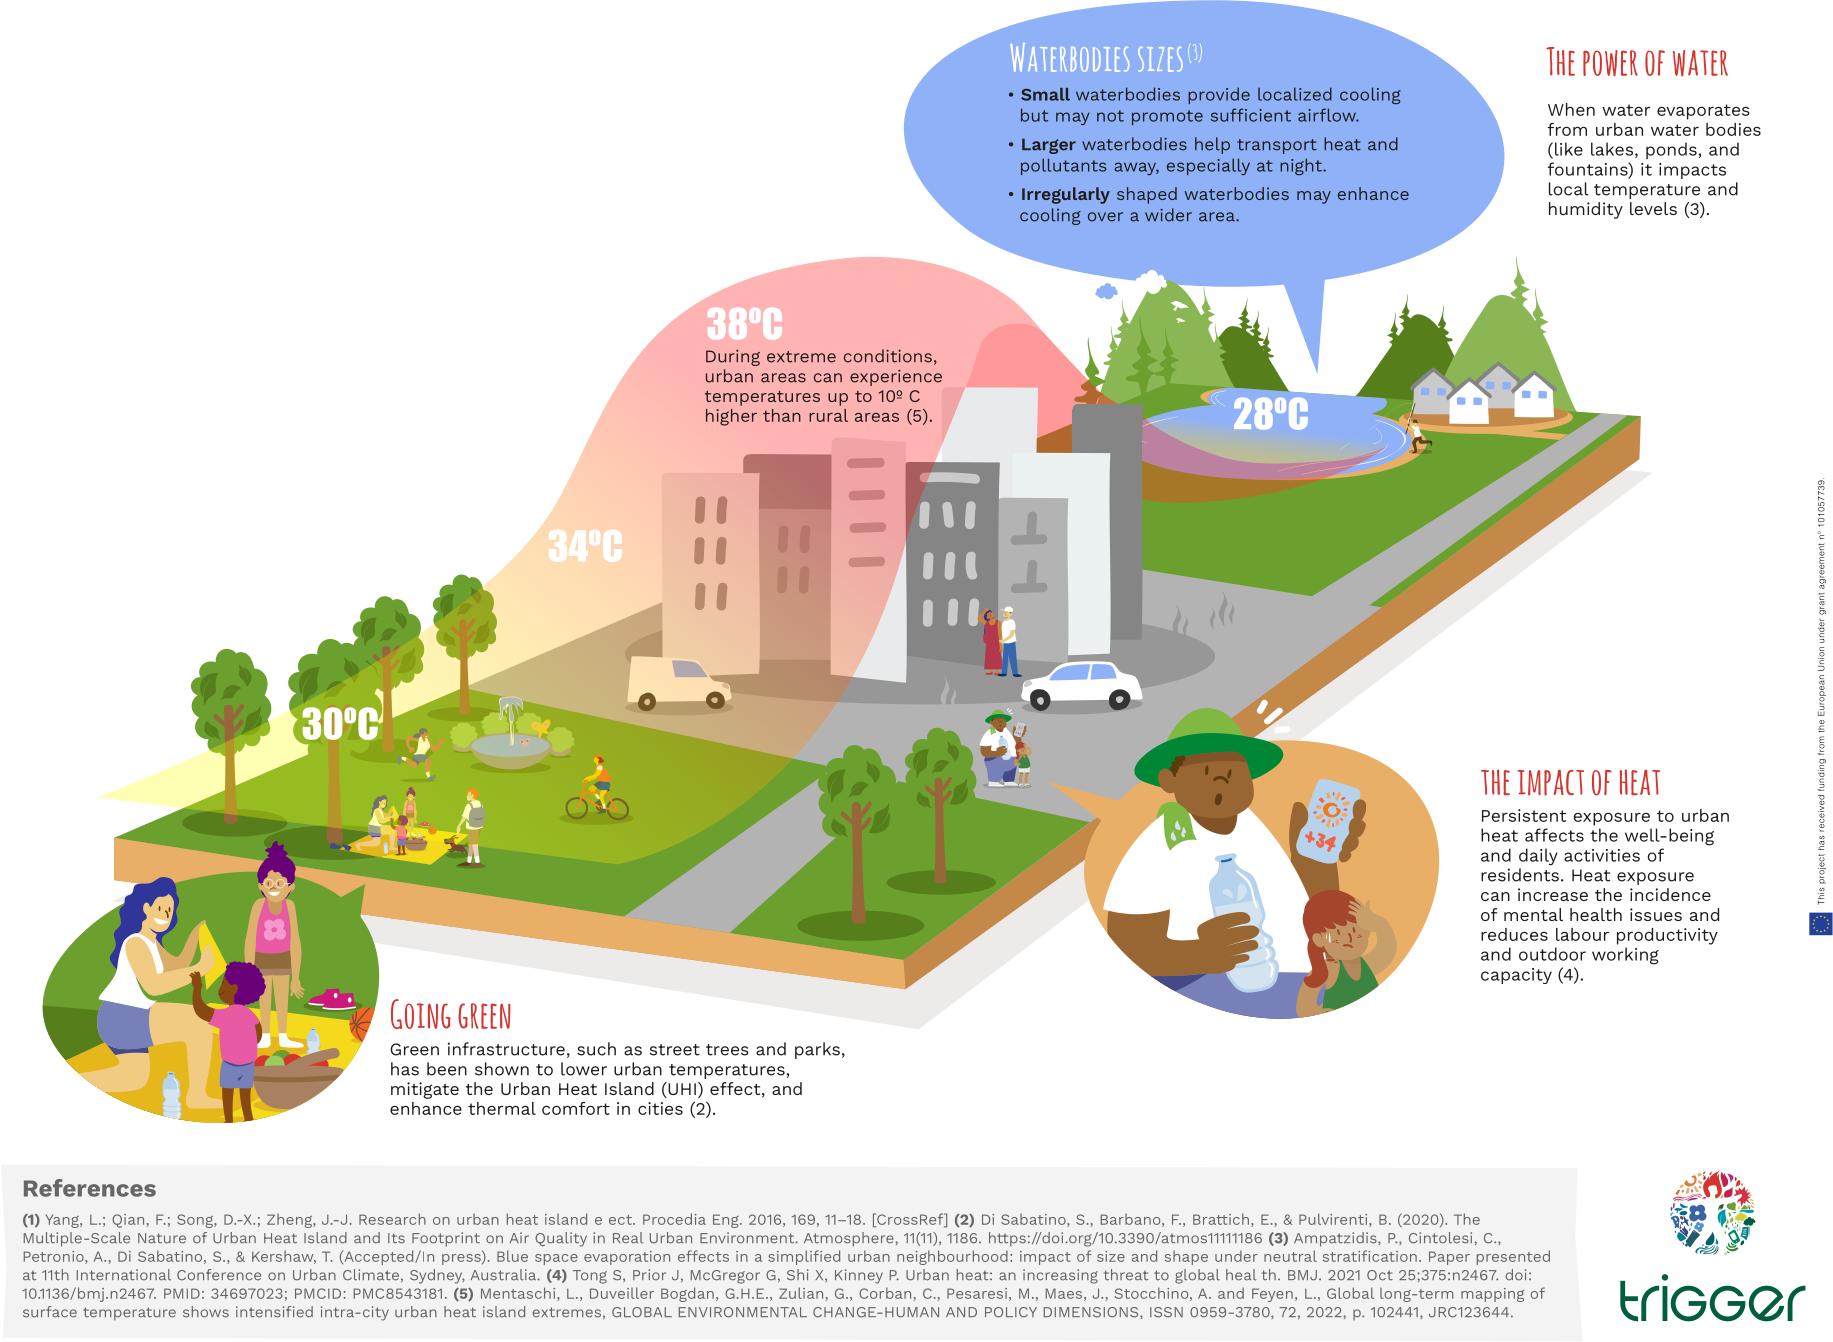
Download the infographic
Explore extreme temperature risks here:
These indicators are linked with exposure (people living in cities, older populations) and vulnerability, helping users understand where extreme heat may pose the greatest health risks. This information supports planning for heat-health action plans, urban cooling strategies, and climate adaptation.

Epidemiological studies help scientists understand how air pollution, like nitrogen dioxide (NO₂), can affect people’s health.
TRIGGER looks at past and current information about air pollution, people’s health, and characteristics of different communities. They use statistical tools to find links between NO₂ levels and health problems, such as breathing difficulties (like asthma), heart disease, and even early death.
By carefully comparing groups of people and considering other factors, like age, lifestyle, or exposure to other pollutants, scientists can figure out how much NO₂ may contribute to health issues.
This information helps governments and health organizations make rules to keep the air cleaner and protect public health.
– INVENTORY OF INDICATORS, TOOLS, AND MODELS
– CO-DEVELOPMENT AND SELECTION OF HEALTH-RELATED HAZARD INDICATORS
– IDENTIFICATION, MONITORING AND QUANTIFICATION OF EXPOSURE AND HEALTH IMPACTS
Researchers studied how meltwater from the Fourcade Glacier flows into the ocean in Antarctica. They found that warmer air temperatures increase the amount of meltwater, which forms a thin layer on the sea surface and quickly spreads into the surrounding ocean.
These freshwater flows can affect ocean circulation, marine ecosystems and sea levels. As more Antarctic glaciers retreat onto land because of climate change, similar meltwater patterns are expected to become more common, with important consequences for the polar environment.
Over time, continued glacier melting also contributes to sea-level rise, increasing the risk of coastal flooding in many parts of the world.
Want to learn more? Read the full publication to explore the study’s methods and findings in greater detail.
This study found that heatwaves and high levels of air pollution, especially ozone, can seriously affect people’s health. The greatest health impacts occurred when both happened at the same time, leading to higher numbers of deaths than either hazard alone.
The findings highlight the importance of preparing for compound climate and air pollution events, which are expected to become more frequent as the climate changes.
Want to learn more? Read the full publication to discover how these combined risks were studied in central and south Europe
A study on Spanish households found that homes where women are the main earners tend to produce lower greenhouse gas emissions from energy use than those where men are the main earners.
The biggest difference comes from private transport. In contrast, the study found no significant differences in emissions related to energy used at home, such as heating or electricity.
These findings suggest that gender can influence consumption patterns linked to climate change.
Want to learn more? Read the full publication to discover how the researchers analysed household consumption and greenhouse gas emissions, and what the findings could mean for future climate and equality policies.
The TRIGGER Project analysed climate-related policies and measures at both international and European levels to understand how well they address the impacts of climate change on human health, including physical, mental and social wellbeing. The project identified strengths, gaps and areas for improvement. These findings provide evidence-based recommendations to help policymakers better integrate health considerations into climate policies.
Across five European cities, TRIGGER has built local Climate-Health Connection (CHC) Labs that turn climate forecasts into real health insight: Augsburg (Germany), Bologna (Italy), Geneva (Switzerland), Heraklion (Greece), and Oulu (Finland) — chosen to span very different climates, health systems, and populations from southern to northern Europe.
Each Lab has its own research focus:
Augsburg & Bologna — clinical studies on respiratory and cardiovascular health
Heraklion — high-risk children and their families
Geneva — testing preventive measures against heat-related illness
Oulu — epidemiological expertise linking climate, healthcare, and population data
Source: Copernicus Health Hub, Nov 2025 — part of the Horizon Europe TRIGGER project
The European Climate Risk Typology is a useful tool for understanding flood risk (among other hazards) across European cities and regions. It brings together climate data and socio-economic information to show how heavy rainfall, prolonged wet periods, and local conditions can increase the risk of flooding.
Explore flood-related climate risks here:
The typology also highlights exposure (such as buildings, infrastructure, and populations in flood-prone areas) and vulnerability, including how prepared a region is to cope with flooding events. Interactive maps make it easier to identify areas facing similar flood challenges and support the development of flood management and adaptation plans.
Explore extreme temperature risks here:
These indicators are linked with exposure (people living in cities, older populations) and vulnerability, helping users understand where extreme heat may pose the greatest health risks. This information supports planning for heat-health action plans, urban cooling strategies, and climate adaptation.
A set of complementary tools supports the assessment of current and future flood risk across Europe by combining climate projections, hydrometeorological indicators, and information on exposure and vulnerability.
European Climate Risk Typology
The European Climate Risk Typology characterises flood risk by integrating hazard, exposure, vulnerability, and adaptive capacity, enabling comparison of cities and regions with similar flood risk profiles and supporting spatial analysis of flood-prone areas.
http://european-crt.org/map.html

EEA Urban Adaptation Map Viewer
The EEA Urban Adaptation Map Viewer provides urban-scale information on observed and projected flood hazards, together with indicators of vulnerability and exposure, enabling cross-city comparison and supporting flood adaptation and resilience planning.
https://eea.maps.arcgis.com/apps/MapSeries/
index.html?appid=ec9a942228894562bd53310e3c3bc211
Climate Impact Explorer
The Climate Impact Explorer offers scenario-based projections of flood-relevant climate drivers, such as changes in precipitation extremes and wet-day intensity, under different warming levels and emission pathways, linking climate impacts to policy-relevant scenarios.
https://climate-impact-explorer.climateanalytics.org/
CORDEX Fire Danger Indicators for Europe
The CORDEX-based climate projections support flood risk analysis through high-resolution regional climate simulations, including indicators such as heavy precipitation and consecutive wet days, enabling assessment of future flood hazard frequency and uncertainty across Europe.
https://cds.climate.copernicus.eu/
To learn more about tools to model the historical variability of atmospheric health-related parameters, to forecast the parameters’ behaviour and to project their change in the future according to various scenarios.
Visit this TRIGGER deliverable: INVENTORY OF INDICATORS, TOOLS, AND MODELS
The Fire Weather Index (FWI) is a tool used around the world to estimate how likely wildfires are to start and spread. It was created by Van Wagner in 1987 and has been widely used since then.
The FWI looks at weather conditions that affect fire, such as:
– how dry plants and soil are,
– how strong the wind is.
The FWI combines all these factors into a single number that represents fire intensity. When the FWI number is higher, the weather conditions are more likely to cause a wildfire.
Experts often divide the scale into categories like “very low,” “low,” “moderate,” and “high” fire danger to match local weather patterns.
This index is useful for planning in many ways. It can help:
– governments and communities prepare for wildfires
– make long-term strategies,
– decide where to invest in fire safety.

The European Climate Risk Typology helps users understand where and why wildfire risk (among other hazards) is higher across Europe.
Using interactive maps and climate indicators, the tool shows how weather conditions, land characteristics, and human exposure combine to increase the likelihood and impact of wildfires in different regions.
Explore wildfire-related climate risks here:
In the portal, you can explore:
– Indicators related to wildfire danger, such as high temperatures, dry conditions, drought, and strong winds.
– Exposure (for example, people, homes, and forests in fire-prone areas)
– Vulnerability, which affects how severe wildfire impacts can be.
By comparing regions with similar wildfire risk profiles, cities and policymakers can learn from each other and improve fire prevention, emergency planning, and resilience strategies.
European Environment Agency – Urban Adaptation Map Viewer
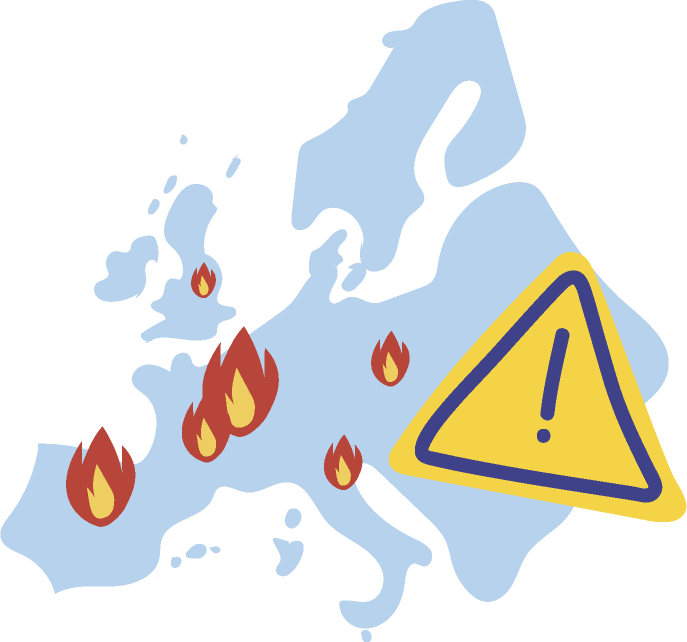
Wildfires in European Cities
Future Wildfire Risk and Climate Change
Understanding Future Wildfire Risk
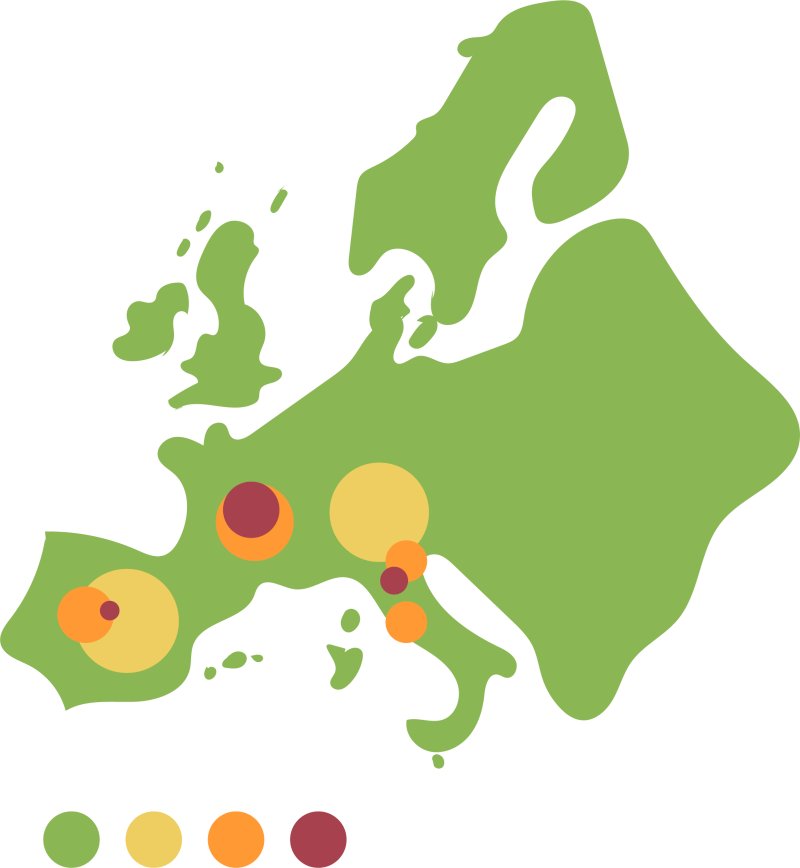
It shows daily and seasonal fire danger levels, including the number of days with moderate, high, or very high fire danger during the main fire season (June to September). These projections are based on advanced climate and fire models and follow European standards used by the European Forest Fire Information System (EFFIS).
The dataset compares today’s climate with different future emission scenarios, ranging from strong climate action to continued high emissions. This helps users understand how climate change could increase wildfire risk and why reducing emissions matters.
European Climate Risk Typology
The European Climate Risk Typology characterises wildfire risk by integrating hazard, exposure, vulnerability, and adaptive capacity, enabling comparison of cities and regions with similar wildfire risk profiles.
http://european-crt.org/map.html
EEA Urban Adaptation Map Viewer
The EEA Urban Adaptation Map Viewer provides urban-scale information on observed and projected wildfire hazards, together with indicators of vulnerability and exposure, supporting cross-city comparison and adaptation planning.
https://eea.maps.arcgis.com/apps/MapSeries/
index.html?appid=ec9a942228894562bd53310e3c3bc211

Climate Impact Explorer
The Climate Impact Explorer offers scenario-based projections of wildfire-relevant climate drivers (e.g. heat extremes, fire-favourable conditions) under different warming levels and emission pathways, linking impacts with policy-relevant scenarios.
https://climate-impact-explorer.climateanalytics.org/
CORDEX Fire Danger Indicators for Europe
The CORDEX Fire Danger Indicators for Europe provide high-resolution projections of fire danger based on the Canadian Fire Weather Index (FWI), using EURO-CORDEX regional climate models and multiple RCP scenarios to quantify changes in fire danger frequency and intensity.
https://cds.climate.copernicus.eu/cdsapp#!/
dataset/sis-tourism-fire-danger-indicators?tab=overview
To learn more about tools to model the historical variability of atmospheric health-related parameters, to forecast the parameters’ behaviour and to project their change in the future according to various scenarios.
Visit this TRIGGER deliverable: INVENTORY OF INDICATORS, TOOLS, AND MODELS

Different policy briefs have been developed by the TRIGGER project, offering evidence-based recommendations to help shape policies across the European Union to protect the health of Europe’s population in a changing climate—especially its most vulnerable.
Topics include cardiovascular and respiratory health, mental well-being, and the often-overlooked human health dimensions of environmental threats such as the hazard scenarios shown in this map.
Each brief draws on the project research at the intersection of climate change and health, highlighting urgent gaps and actionable insights for policymakers.
Source: Rückle et al., 2025, Frontiers in Psychiatry

Source: Rückle et al., 2025, Frontiers in Psychiatry



The course reflects TRIGGER’s most recent findings, tools, and outcomes, with contributions from experts working in the project.
The course is organized into six modules that go from exploring climate change and human health, monitoring and warning, and vulnerable populations. The course then turns to climate action, engagement, and policy pathways, exploring how individuals, communities, and policymakers can respond.